matplotlibでグラフのスムージング
イントロダクション
gnuplotではスムージングという機能があります。
pythonのグラフ描画ライブラリのmatplotlibには、残念ながら、直接スムージングできる機能はありません。
そのため、numpyやscipyを使って、実現する必要があります。
線形補間
matplotlibの設定を変更しなかったら、グラフは線形補間(linear interpolation)されます。
いわゆる、折れ線グラフになります。
以下はプログラム
# -*- coding: utf-8 -*- #

import numpy as np
import matplotlib.pyplot as plt

def make_func(in_x):
    np.random.seed(0)
    out_y = np.exp(-in_x) + 0.4*(np.random.rand(in_x.size) - 0.5) # exp(-x)の式にランダムな誤差を入れる
    return out_y

def main():
    x1 = np.linspace(0, 10, 10)
    y1 = make_func(x1)

    plt.plot(x1, y1, color='b', label='linear', alpha=0.7)
    plt.legend()
    plt.show()

if __name__ == '__main__':
    main()
結果

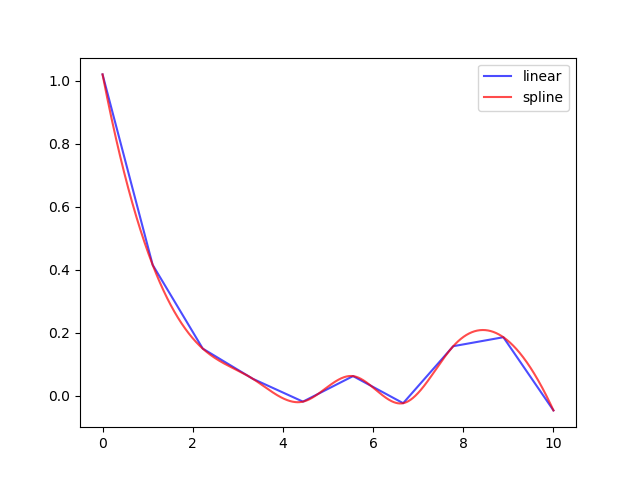
スプライン補間
離散データを非線形補間する方法として、スプライン補間(spline interpolation)というものがあります。
これは離散データを区間ごとに分けて、それぞれを多項式で補間することです。
代表的なスプライン補間は、3次のスプライン補間(cubic spline)です。
詳しくはこちらのサイトを見てください。
以下はプログラム
# -*- coding: utf-8 -*- #

import numpy as np
import matplotlib.pyplot as plt
from scipy.interpolate import interp1d # scipyのモジュールを使う

def make_func(in_x):
    np.random.seed(0)
    out_y = np.exp(-in_x) + 0.4*(np.random.rand(in_x.size) - 0.5) # exp(-x)の式にランダムな誤差を入れる
    return out_y

def spline_interp(in_x, in_y):
    out_x = np.linspace(np.min(in_x), np.max(in_x), np.size(in_x)*100) # もとのxの個数より多いxを用意
    func_spline = interp1d(in_x, in_y, kind='cubic') # cubicは3次のスプライン曲線
    out_y = func_spline(out_x) # func_splineはscipyオリジナルの型

    return out_x, out_y

def main():
    x1 = np.linspace(0, 10, 10)
    y1 = make_func(x1)

    x2, y2 = spline_interp(x1, y1)

    plt.plot(x1, y1, color='b', label='linear', alpha=0.7)
    plt.plot(x2, y2, color='r', label='spline', alpha=0.7)
    plt.legend()
    plt.show()

if __name__ == '__main__':
    main()
結果

移動平均
時系列データを扱う場合、スプライン補間だけではなく、移動平均(moving average)も使われます。
移動平均とは、一定区間ごとに平均値を出すことです。
移動平均はフィルターや深層学習で有名な畳込みニューラルネット(convolutional neural network)に応用されています。
こちらや、こちらに詳しい説明があります。
プログラム上ではnumpyのconvolve関数を使っています。
今回は重みが平等になるように設定しています。
convolve関数の使い方については、公式を見てください。
3項で移動平均したときのプログラムは以下
# -*- coding: utf-8 -*- #

import numpy as np
import matplotlib.pyplot as plt
from scipy.interpolate import interp1d # scipyのモジュールを使う

def make_func(in_x):
    np.random.seed(0)
    out_y = np.exp(-in_x) + 0.4*(np.random.rand(in_x.size) - 0.5) # exp(-x)の式にランダムな誤差を入れる
    return out_y

def spline_interp(in_x, in_y):
    out_x = np.linspace(np.min(in_x), np.max(in_x), np.size(in_x)*100) # もとのxの個数より多いxを用意
    func_spline = interp1d(in_x, in_y, kind='cubic') # cubicは3次のスプライン曲線
    out_y = func_spline(out_x) # func_splineはscipyオリジナルの型

    return out_x, out_y

def moving_avg(in_x, in_y):
    np_y_conv = np.convolve(in_y, np.ones(3)/float(3), mode='valid') # 畳み込む
    out_x_dat = np.linspace(np.min(in_x), np.max(in_x), np.size(np_y_conv))

    return out_x_dat, np_y_conv

def main():
    x1 = np.linspace(0, 10, 10)
    y1 = make_func(x1)

    x2, y2 = spline_interp(x1, y1)

    x3, y3 = moving_avg(x1, y1)
    x4, y4 = spline_interp(x3, y3)

    plt.plot(x1, y1, color='b', label='linear', alpha=0.7)
    plt.plot(x2, y2, color='r', label='spline', alpha=0.7)
    plt.plot(x4, y4, color='g', label='average + spline', alpha=0.7)
    plt.legend()
    plt.show()

if __name__ == '__main__':
    main()
結果

オリジナルのデータ点を増やし、5項で移動平均した場合

補足
同じxに対して複数のyがあるデータをgnuplotで3次のスプライン補間すると、スプライン曲線がデータ点を通っておらず、補間だけでは実現できないなめらかさを持っています。
公式サイトで調べてみると、同一のxに対して複数のyがある場合、yの値を平均した値を補間しているとの記述がありました。
いずれ挑戦したいと思います。